
The demographic landscape is undergoing a significant shift as the number of elderly individuals living alone continues to rise, outpacing the number of young people in single-person households. This trend, observed for the second consecutive year, highlights the rapid aging of the population and its profound impact on household structures.
According to recent statistical data, a considerable proportion of single-person households are now comprised of individuals aged 70 and above.
Key Statistics on Single-Person Households
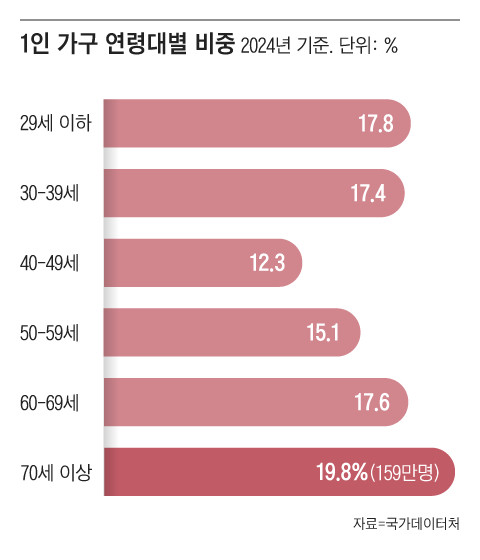
- Age Distribution: The proportion of single-person households aged 70 and above reached 19.8% last year, the highest among all age groups. Those aged 29 and below accounted for 17.8%.
- Widening Gap: The difference between these two age groups has widened to 2 percentage points, a significant increase from the 0.5 percentage points recorded the previous year.
- Absolute Numbers: There are approximately 1,590,000 single-person households aged 70 and above, exceeding the 1,430,000 households aged 29 and below by 160,000. This represents a reversal from 2022, when the younger demographic had a higher number of single-person households.

- Overall Growth: The total number of single-person households has reached 8,045,000, an increase of 216,000 from the previous year. This constitutes 36.1% of all households, which number 22,294,000.
- Consistent Increase: The proportion of single-person households has been steadily increasing, exceeding 30% in 2019 and continuing to rise by approximately 1 percentage point annually.
Increased Welfare Demand
The growing number of elderly individuals living alone has resulted in a greater demand for welfare services.
- Beneficiary Households: Last year, 1,397,000 single-person households received National Basic Living Security benefits, an increase of 83,000 households (6.3%) from the previous year.
- Proportion of Beneficiaries: Single-person households account for 74.2% of all beneficiary households, a record high. This ratio has been increasing since 2015.
Economic Vulnerabilities
The economic circumstances of single-person households remain precarious, with significantly lower income levels compared to the average household.
- Income Disparity: The annual income of single-person households averaged 34.23 million Korean won, only 46.1% of the average household income (74.27 million Korean won).
- Low-Income Households: Over half (53.6%) of single-person households have an annual income below 30 million Korean won.
- Consumption Expenditure: Monthly average consumption expenditure for single-person households was 1,689,000 Korean won, 58.4% of the overall household average (2,890,000 Korean won).
- Major Expenses: Housing, water, and energy (18.4%) and food and accommodation (18.2%) constitute the largest portions of expenditure.
Housing Conditions
Many single-person households face inadequate housing conditions, characterized by small living spaces and lower homeownership rates.
- Limited Space: Nearly half (49.6%) of single-person households reside in spaces of 40 square meters or less.
- Smaller Living Area: The average residential area for single-person households is 47.1 square meters, 68.4% of the overall household average (68.9 square meters).
- Homeownership Rates: The overall homeownership rate for single-person households is 32%, significantly lower than the rate for all households (56.9%).
- Age-Based Disparities: Homeownership rates vary considerably by age group.
- Those aged 29 and below have a homeownership rate of only 5.0%.
- Those aged 70 and above have a rate of 50.9%.
- Individuals in their 60s (43.7%) and 50s (38.6%) also exceed the average.
- Age-Based Disparities: Homeownership rates vary considerably by age group.
Healthcare Expenditure
Healthcare expenditure poses a significant burden on single-person households, given their lower income levels.
- Healthcare Costs: The monthly average healthcare expenditure for single-person households is 122,000 Korean won, 54.2% of the overall household average (225,000 Korean won).
- Breakdown of Expenses: Outpatient medical services account for the largest share of healthcare expenditure (41.7%), followed by pharmaceuticals (18.6%) and inpatient services (15.7%).
Regional Distribution
Single-person households are concentrated in specific regions, with Seoul and Gyeonggi Province having the highest numbers.
- Regional Concentration: 42.7% of single-person households are located in Seoul and Gyeonggi.
- Highest Numbers: Gyeonggi Province has the highest number of single-person households at 1,775,000 (22.1%), followed by Seoul with 1,661,000 (20.6%).
- Highest Proportion: The proportion of single-person households relative to all households is highest in Seoul (39.9%), followed by Daejeon (39.8%) and Gangwon (39.4%).
Social Relationships and Well-being
Single-person households often experience challenges related to social connections and feelings of loneliness.
- Satisfaction with Relationships: Only 51.1% of single-person households expressed satisfaction with their overall interpersonal relationships, lower than the overall average (55.5%).
- Support Networks: 68.9% reported having someone to rely on when sick, lower than the overall average (75.1%).
- Feelings of Loneliness: 48.9% reported feeling lonely on a regular basis, higher than the overall average (38.2%).
The increasing prevalence of single-person households, particularly among the elderly, is attributed to factors such as aging, delayed marriage, and non-marriage. This demographic shift presents significant challenges related to welfare, economic security, housing, healthcare, and social well-being. Addressing these challenges requires comprehensive policies and support systems tailored to the specific needs of single-person households.